Global Assessment of Reptile Distributions
  • Home
  • About
  • People
  • Activities
  • Meetings
  • Publications
  • Data
  • Links
  • Collaborations
  • BloGARD

Modelling IUCN threat status for global reptiles

1/5/2022

1 Comment

 
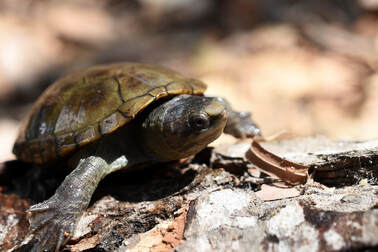
PictureVallarta Mud Turtle (Kinosternon vogti), classified as ‘Critically Endangered’ by the automated assessment method and as not evaluated by the IUCN Red List of Threatened Species (Photo: Agencia Informativa Conacyt/ Wikimedia)
Reptiles comprise nearly 11,800 species worldwide, and are the most species-rich land-vertebrate group. After 18 years of laborious work by many experts globally, early in 2022, the first extinction risk assessment of this group was completed (the Global Reptile Assessment). This important endeavor will enable adding reptiles to global conservation policy and management initiatives as one of the major groups assessed. Nevertheless, this assessment still leaves over 3000 reptile species that have either not been assessed or were assigned a data deficient category that prevents their prioritization for conservation. In an effort to fill-in this gap a new publication in the journal PLOS Biology, we presents estimates of extinction risk for those species currently neglected by the Global Reptile Assessment, using novel machine learning modelling. importantly we found that unassessed and data deficient reptile species are more likely to threatened than assessed species.
Gabriel Caetano, lead author of the paper explained “The IUCN threat assessment procedure is highly important, yet very lengthy, data intensive, subject to human decision biases, and relies on in-person meetings of experts. However, we can use information on already assessed species to better understand the risks to those not yet assessed. Species may share physiological, geographic, and ecological attributes (often via shared evolutionary history) that make them more threatened, and experience similar sources of threat when they occur at similar locations. In our work we tried to emulate the IUCN process using predominantly remotely sensed data and advanced machine learning methods. We used species that have been assessed to teach our models what makes a species threatened and then predict the threat categories of unassessed species”. He added “our new methods are important for highlighting reptile species at risk and can be used on other groups as an initial shortcut for threat categorization”.
Shai Meiri added “Importantly, the additional reptile species identified as threatened by our models are not distributed randomly across the globe or the reptilian evolutionary tree. Our added information highlights that there are more reptile species in peril – especially in Australia, Madagascar, and the Amazon basin – all of which have a high diversity of reptiles and should be targeted for extra conservation effort. Moreover, species rich groups, such as geckos and elapids (cobras, mambas, coral snakes, and others), are probably more threatened than the Global Reptile Assessment currently highlights, these groups should also be the focus of more conservation attention”
Uri Roll mentioned “Our work could be very important in helping the global efforts to prioritize the conservation of species at risk – for example using the IUCN red-list mechanism. Our world is facing a biodiversity crisis, and severe man-made changes to ecosystems and species, yet funds allocated for conservation are very limited. Consequently, it is key that we use these limited funds where they could provide the greatest benefits. Advanced tools- such as those we have employed here, together with accumulating data, could greatly cut the time and cost needed to assess extinction risk, and thus pave the way for more informed conservation decision making”.

Picture
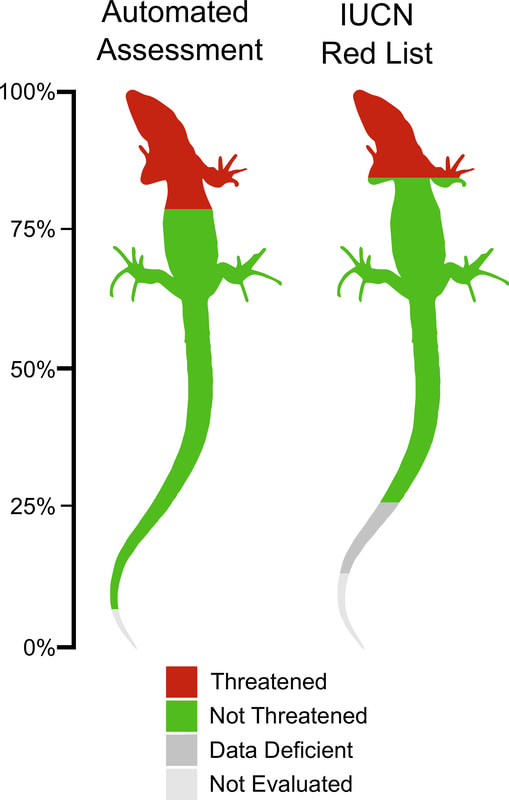
Proportion of reptile species in different threat categories for an Automated Assessment Method and for the IUCN Red List of Threatened Species.
1 Comment

Between a rock and a hard place – unique rare species face grave dangers due to human action

24/11/2021

1 Comment

 
In a recent paper published in the journal Science Advances Gopal explored drivers of phylogenetically endemic land vertebrates. He also looked at conservation attributes of regions with high phylogenetically endemic species.

We live in the age of the ‘sixth mass extinction’. Our daily activities are causing hundreds and thousands of species to be lost forever. To turn the tide on the biodiversity crisis we have to identify those regions and species that are most in need of our conservation efforts. However, the characteristics of regions or species most in need of protection are not always clear. In this work we focus on those species that have two distinct features that make especially good candidates for conservation efforts. First – they are confined to only small and distinct location on the globe – what are known as endemic species and face greater risk of extinction. Second – they are evolutionary unique - they do not have close relatives on the ‘tree of life’ and their loss will represent a loss of millions of years of evolution. Species that poses both of these attributes (phylogenetic endemics) are therefore of great conservation importance as they represent unique and threatened components of biodiversity. To explore these species, we collected data regarding the evolutionary relationships and geographic distribution of almost all land vertebrate species (~30,000 species of amphibians, birds, mammals, and reptiles). We set out to map global ‘hotpots’ of such species, understand what are the unique conditions that support them, and evaluate their current protection and threats.
Picture
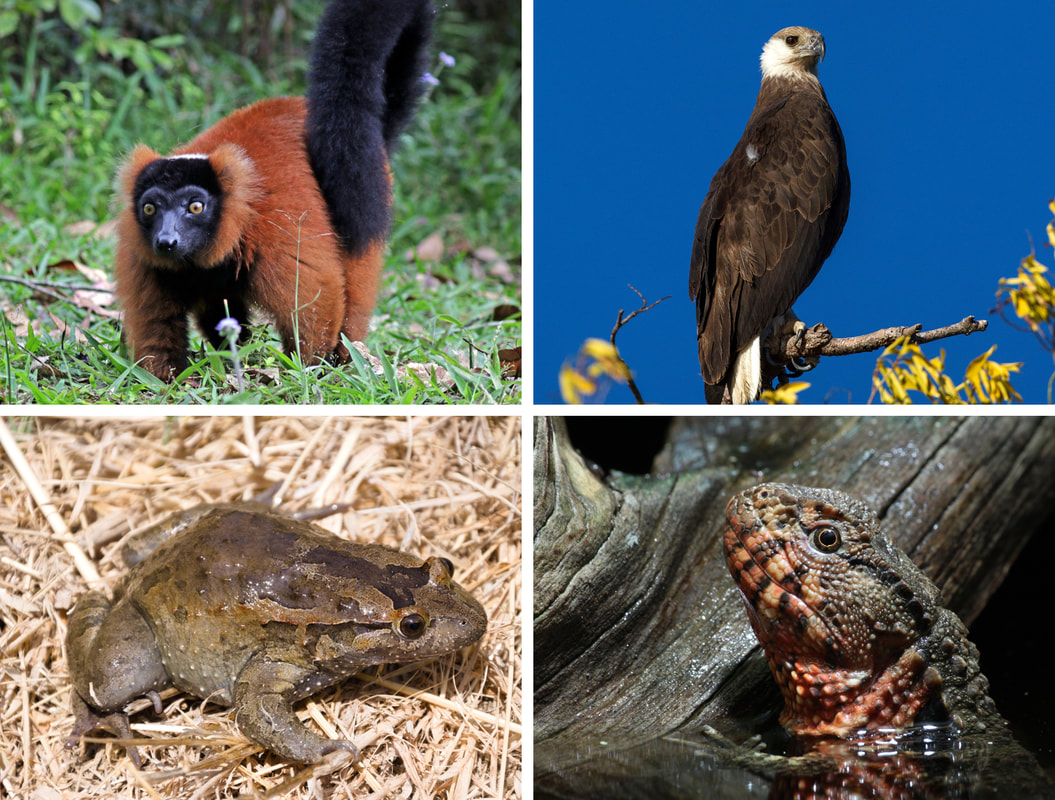
Some of the range-restricted evolutionary unique species. The Red ruffed lemur (photo credit: Charles J Sharp), Madagascar fish eagle (photo credit: Anjajavy le Lodge), Hula painted frog (photo credit: Gopal Murali - own image), and Chinese Crocodile Lizard (photo credit: Holger Krisp). Images from Wikimedia Commons (apart from the painted frog).

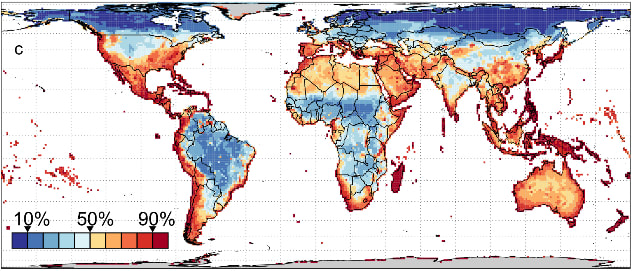
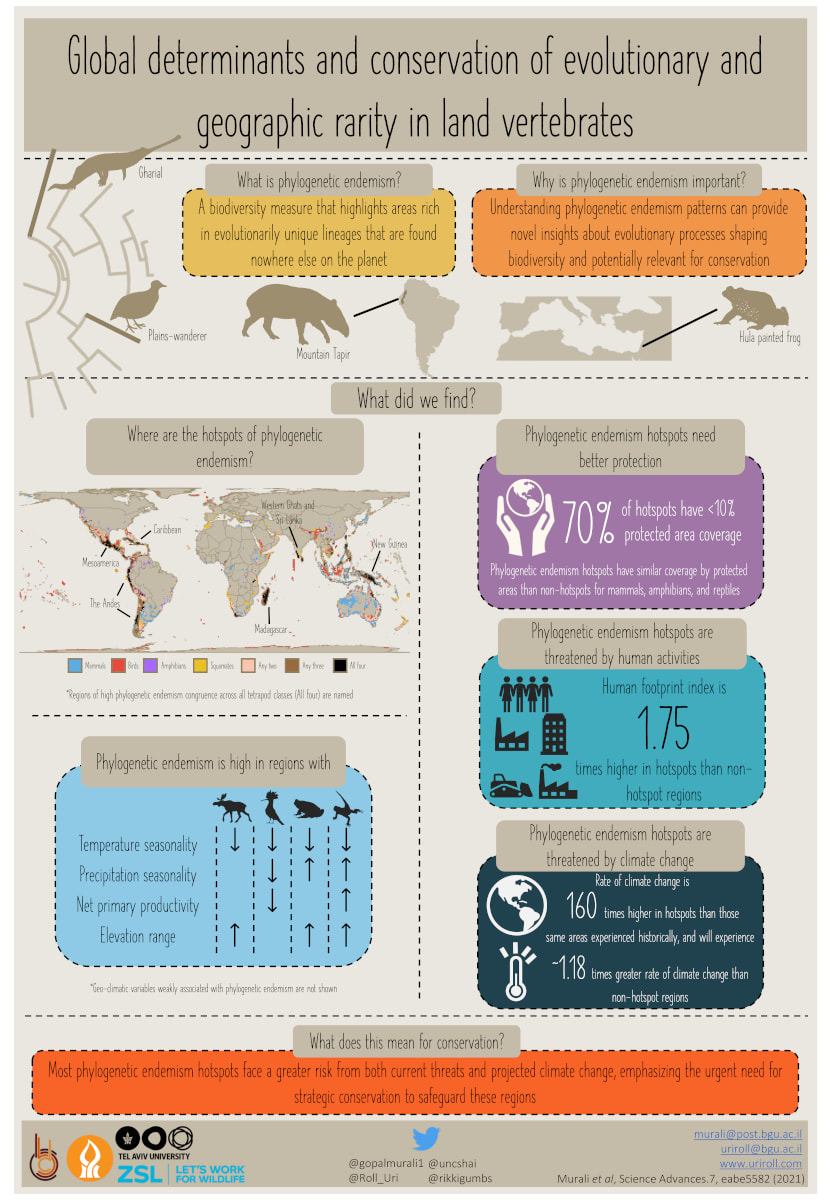
We found that hotspots of phylogenetically endemic species mostly occur in the tropics and in the southern hemisphere along mountain ranges and in islands. Altogether, these hotspots, when combining the hotspots for all of the four above-mentioned groups, they occupy 22% of the total landmass. Hotspots that were important for all of the four groups are located in the Caribbean islands, Central America, along the Andes, eastern Madagascar, Sri Lanka, southern Western Ghats in India, and New Guinea. Although some of these regions have been previously prioritized for conservation actions, our study also found hotspots outside well-known biodiversity centres. For instance, we found the Asir mountains in Saudi Arabia to be important for such unique birds and Morocco to harbour phylogenetically endemic reptiles. Globally, these regions are mostly defined as mountainous tropical regions. This finding supports the notion that tropical mountains have an important role in the generation and maintenance of biodiversity.

Picture
Global map of Phylogenetic endemism hotspots for all land vertebrates corrected for species richness

We next quantified how human activities and climate change are threatening these hotspots. Alarmingly, we found human activities such as buildings, roads, land-use, population density, and rate of climate change to be disproportionately higher in these hotspots (when compared to regions outside them). Consequently, our study highlights that many uniquely rare species, which probably perform important roles in the ecosystem, will be the first to be lost due to global change. Furthermore, we found most of the hotspots are not adequately protected. About 70% of the hotspots regions have less than 10% overlap with protected areas. Some of these regions which require urgent conservation action are the southern Andes, Horn of Africa, Southern Africa, and the Solomon Islands.
 
To-date most conservation strategies still focus on species-rich regions or flagship species, which may miss out on regions with uniquely rare species we identified. Overall, our study emphasizes on the need for strategic conservation policy and management to safeguard the persistence of thousands of small-ranged species that represent millions of years of unique evolutionary history.

Picture
Infographic representing this work. Press to download in high resolution
Author: Gopal Murali
1 Comment

A short history of GARD and how it has been used to highlight gaps in global conservation priorities

9/10/2017

2 Comments

 
In a paper published in Nature Ecology and Evolution we present the first global maps of all reptiles - and thus complete the global distributions of all tetrapods. We further explore how the new reptile information changes how we think about global conservation priorities. As this is the first place where all of the GARD maps have been used and published, we use this opportunity to share some of the history of GARD itself, as well as the particular work that was carried out for this paper.

The beginnings of GARD
Planning for reptile conservation globally we first needed to map the distribution of all known species. About 8500 of them when we started in 2006, about 10,500 now recognized. This was a time when such global databases were being published for amphibians, birds, and mammals – some of us have been instrumental in assembling those databases, so we felt fairly confident we knew how it should be done.
What we were wondering, however, was whether the fact that reptile distributions were not collated at the time was not because it couldn’t be. A quick survey of available field guides and herpetology books revealed that maps of the sort used to assemble distribution data for birds and mammals were simply unavailable for huge parts of the world, including most of the crucial regions in tropical South America, Africa and Southern Asia.
Picture
GARD meeting, Oxford (photo: Uri Roll)
Picture
GARDians competing for that 'perfect' picture of a gecko
Thus the Global Assessment of Reptile Distribution working group (GARD) was formed. In the meantime we started recruiting the people who did much of the actual legwork – graduate students who digitized maps from existing sources, as well as the maps that started pouring in from the reptile experts among the GARD members. We had to keep track with constant taxonomic changes, species splits and new reptile species discoveries (many of them by GARD members themselves) – resulting in additional 200 species or reptiles nowadays being added annually.
We finally had at least some data for all the species or reptiles we thought one could map about two year ago. Then we met again to start the immensely important process of reviewing the distribution data to ensure errors were kept to the minimum (a process that is still ongoing).
Early on in compiling the data we got the feeling that lizard ‘hotspots’ were not in the tropics, where virtually all other groups studied so far have the most species. Once the maps were fully compiled this was very evident. The unique thermal requirements of reptiles enable them to thrive in drier habitats, allowing them to evolve and prosper in deserts.
Picture
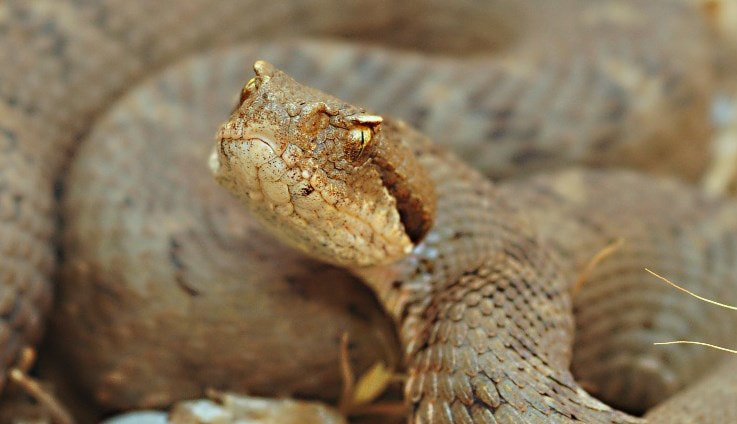
Vipera bornmuelleri (photo: Uri Roll)
Do unique reptilian biologies and ecologies demand particular conservation needs?
Or in other words do the major global conservation priorities designations adequately represent reptiles or do their unique distributions make them less protected. It turns out that many reptiles – predominantly lizards and turtles are left out of global priority regions and protected areas.
Picture
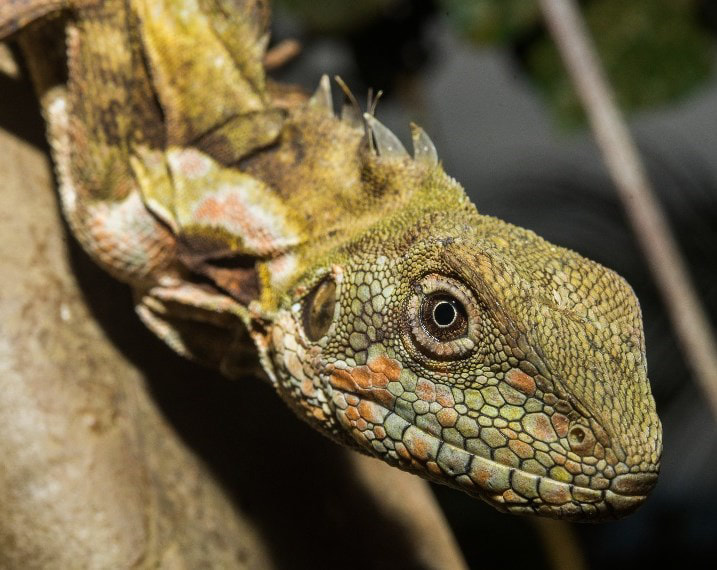
Hypsilurus papuensis (photo: Alex Slavenko)
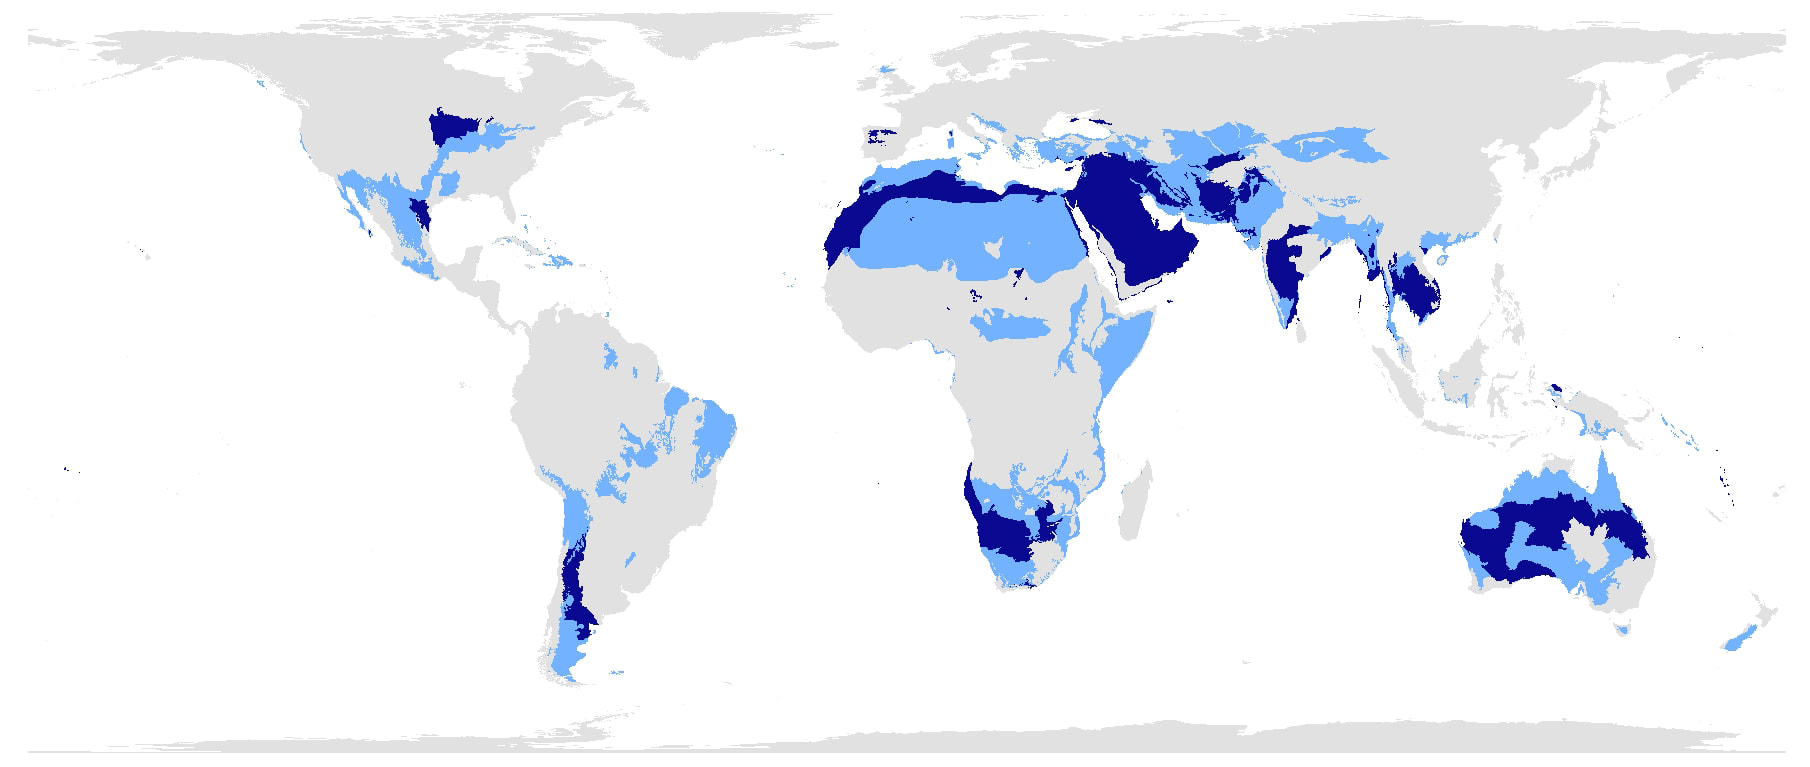
We therefore wanted to explore how the focus of future conservation efforts need to change to properly represent reptiles. To do this we run prioritization optimization procedures which enabled us to highlight various regions of the world predominantly in drylands, savannah, steppe, and also islands that increase in importance when reptile distribution data are added. More broadly this work highlights the need of getting better data for lesser known groups in order to compile truly inclusive conservation planning that encapsulates all of biodiversity.
Picture
Ecoregions that increase in importance for conservation, when reptile data are added (dark blue - top decile ecoregions, light blue - top quartile ecoregions)​
Authors: Shai Meiri and Uri Roll
2 Comments

Patterns of species richness, endemism and environmental gradients of African reptiles

28/7/2016

2 Comments

 
In our recent publication in the Journal of Biogeography, we assembled a comprehensive distribution map of all reptiles in Africa in order to quantify their geographical overlap with the other vertebrate groups, and to assess the environmental correlates underlying these patterns.
The latitudinal gradient of increasing biological diversity towards the equator is one of the best recognized patterns in biogeography, and has been acknowledged for some time. The naturalist, Alexander von Humboldt wrote of his travels over 200 hundred years ago, that as we approach the tropics, "the greater the variety of structure, form, colour, youth and vigor of organic life." A number of well-known hypotheses explaining this pervasive pattern of the increasing number of different species towards the equator have since proliferated. These include elevated ambient energy and precipitation, the number of different habitats or niches, higher plant productivity, and many more.
Until now reptile diversity gradients have remained largely unmapped and the least studied of the terrestrial vertebrates, especially in Africa. This is an important distinction because reptiles are an extremely diverse class of terrestrial vertebrates (over 10,000 species and counting), and as ectotherms, which often thrive in arid regions, their diversity patterns are thought to differ from the classic latitudinal gradient of the other land vertebrates (amphibians, birds, and mammals). In addition, the distinct reptile lineages - amphisbaenians, crocodiles, lizards, snakes, and turtles are likely to respond differently to environmental variables.

Picture
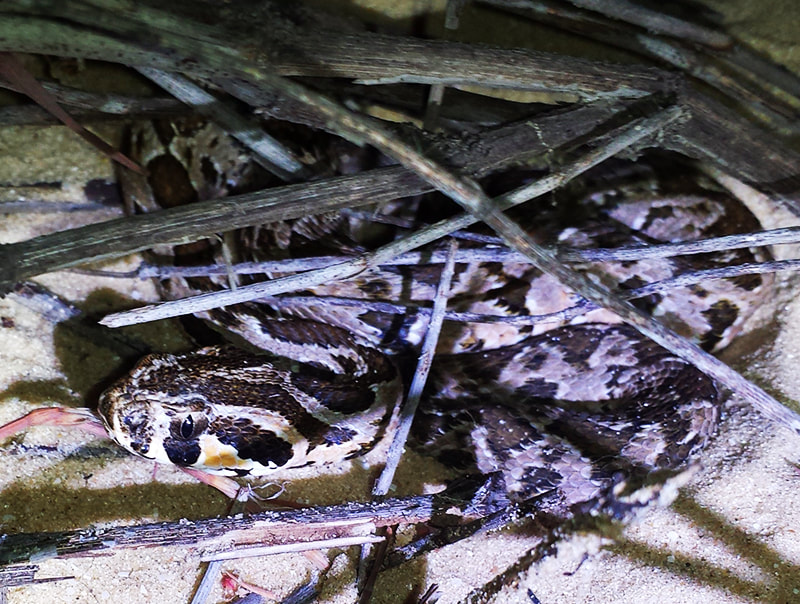
Vipera palaestinae (photo: Uri Roll)
To create our geographic distribution map of reptiles in Africa, we obtained data from a variety of field-guides and atlases, museum databases, the primary literature, IUCN assessments, and maps based on expert knowledge of reptile species and the habitats they occupy. A challenging aspect of the project was to ensure that our maps remained current with respect to new species discoveries and taxonomic name changes (which are constantly being revised), and we also had to confirm the validity of type specimen identifications and localities, especially those referenced from obscure sources and archaic museum specimens. We used GIS software to digitize and overlay the maps of each individual African reptile species (1,601 species in total!) one on top of the other, which allowed us to count the number of species present in a given area - which we call “species richness”.
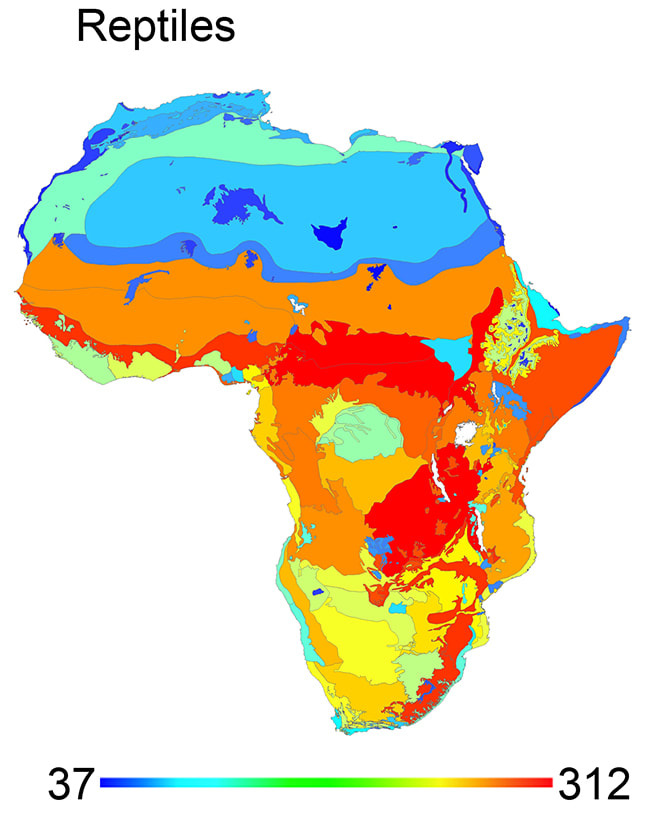
Here is the product of all of that hard work - the first comprehensive richness map of all reptile species in Africa. The colour codes correspond to the number of species from low (blue) to high (red). It shows that the reptile richness map is largely congruent with previously mapped amphibian, bird, and mammal richness showing the classic species latitudinal gradient, including high richness in the arid regions not seen in the other vertebrates. But when you look at the reptile groups distinctly you see that while the overall reptile richness map mostly resembles snakes, lizards in particular are qualitatively very different. Lizard richness hotspots are widely dispersed with high diversity in tropical regions, as well as arid and mountainous areas, where the distribution of the other reptile and non-reptile groups is relatively low.

Picture
When we looked at which environmental predictors best explained these species richness maps we found that net primary productivity (the amount of photosynthetic activity by plants) and precipitation explain most of the variation in reptile and other vertebrates. This explains the clear latitudinal pattern seen in their respective maps, which reflects a strong correlation with plant productivity and rainfall as you move closer to the equator. But again, lizards are unique in that none of these environmental correlates explain their distributions. This is because lizards are well adapted to a wide range of habitats including the tropics as well as the harsh conditions of the desert where plant productivity and rainfall are low. We also showed that individual lizard species on average occupy smaller geographic distributions, reflecting their ability to occupy diverse niches.
Picture
Our findings that the distribution of lizard species in Africa is unique when compared to the other vertebrate groups now confirms a pattern that has been seen elsewhere in previous studies (i.e. Australia) and most recently by our paper on the global distribution of reptiles. This shows the importance of studying the diverse reptile groups distinctly instead of lumping them all together, and will have bearing on large-scale conservation efforts that do not represent all reptile groups.
Author: Amir Lewin
2 Comments

    Author

    Mainly maintained by Shai Meiri and Uri Roll

    Archives

    October 2022
    May 2022
    November 2021
    June 2020
    March 2020
    February 2020
    January 2020
    July 2019
    January 2019
    October 2018
    August 2018
    May 2018
    November 2017
    October 2017
    September 2017
    January 2017
    August 2016
    July 2016
    May 2016

    Categories

    All
    Africa
    Amniotes
    Australia
    Big Data
    Big-data
    Body Size
    Body-size
    Climate
    Clutch Size
    Clutch-size
    Competition
    Conservation
    Deserts & Drylands
    Diet
    Diversification
    Diversity Patterns
    Ecogeographic Rules
    Euroasia
    Evolution
    Extinctions
    Functional Diversity
    GARD History
    Geckos
    Hotspots
    In Memoriam
    Islands
    Island Syndrome
    Late Quaternary
    Latitudinal Diversity Gradient
    Lizards
    Longevity
    Metabolism
    New Guinea
    Nocturnality
    Palearctic
    Priritization
    Reproduction
    Speciation
    Tetrapods
    Tropics
    Type Specimens
    Viviparity
    Wikipedia

    RSS Feed

Powered by Create your own unique website with customizable templates.